How much is a patent worth? Lessons from Vectura v GSK.
Testing Gate IP's AI-assisted valuation methodology against the public record of Vectura v GSK — from validity and competitive patents to market evidence and a worked valuation.
Can an AI-assisted patent valuation process produce a defensible estimate when tested against a real, contested patent? That is the question behind this Gate IP case study. Rather than begin with a royalty assumption and work backwards, we begin with the evidence.
Gate IP's valuation process is built on three foundational research reports: a Validity Search (or Patentability Search, depending on the asset and question), a Patent Landscape, and a Market Analysis. Together, they examine the strength and boundaries of the claims, the competing technological environment, and the markets in which the invention might create economic value. Those findings then feed a fourth deliverable: the Patent Valuation Report. Each report is available separately through Gate IP.
To test this process, we selected Vectura's US Patent 8,303,991 B2, a dry-powder pharmaceutical particle invention examined in the public Vectura v GSK dispute. The case provides an unusually valuable external reference: a historical commercial licensing arrangement and a subsequent court damages assessment. Neither should be mistaken for the independent market value of this individual patent, but both allow us to scrutinise the logic of an AI-assisted analysis.
This article sets out what we found and how the reports connect. Using a 31 December 2017 valuation date, our worked valuation report produces an illustrative £3.16 million base-case discounted licensing scenario, with considerable sensitivity to patent coverage, licensing rights and other unverified assumptions. It is a testable model result, not a court-determined valuation or a verified transaction price. The value of this exercise lies in showing exactly how that estimate was assembled—and where the evidence remains incomplete.
The patent was not the inhaler
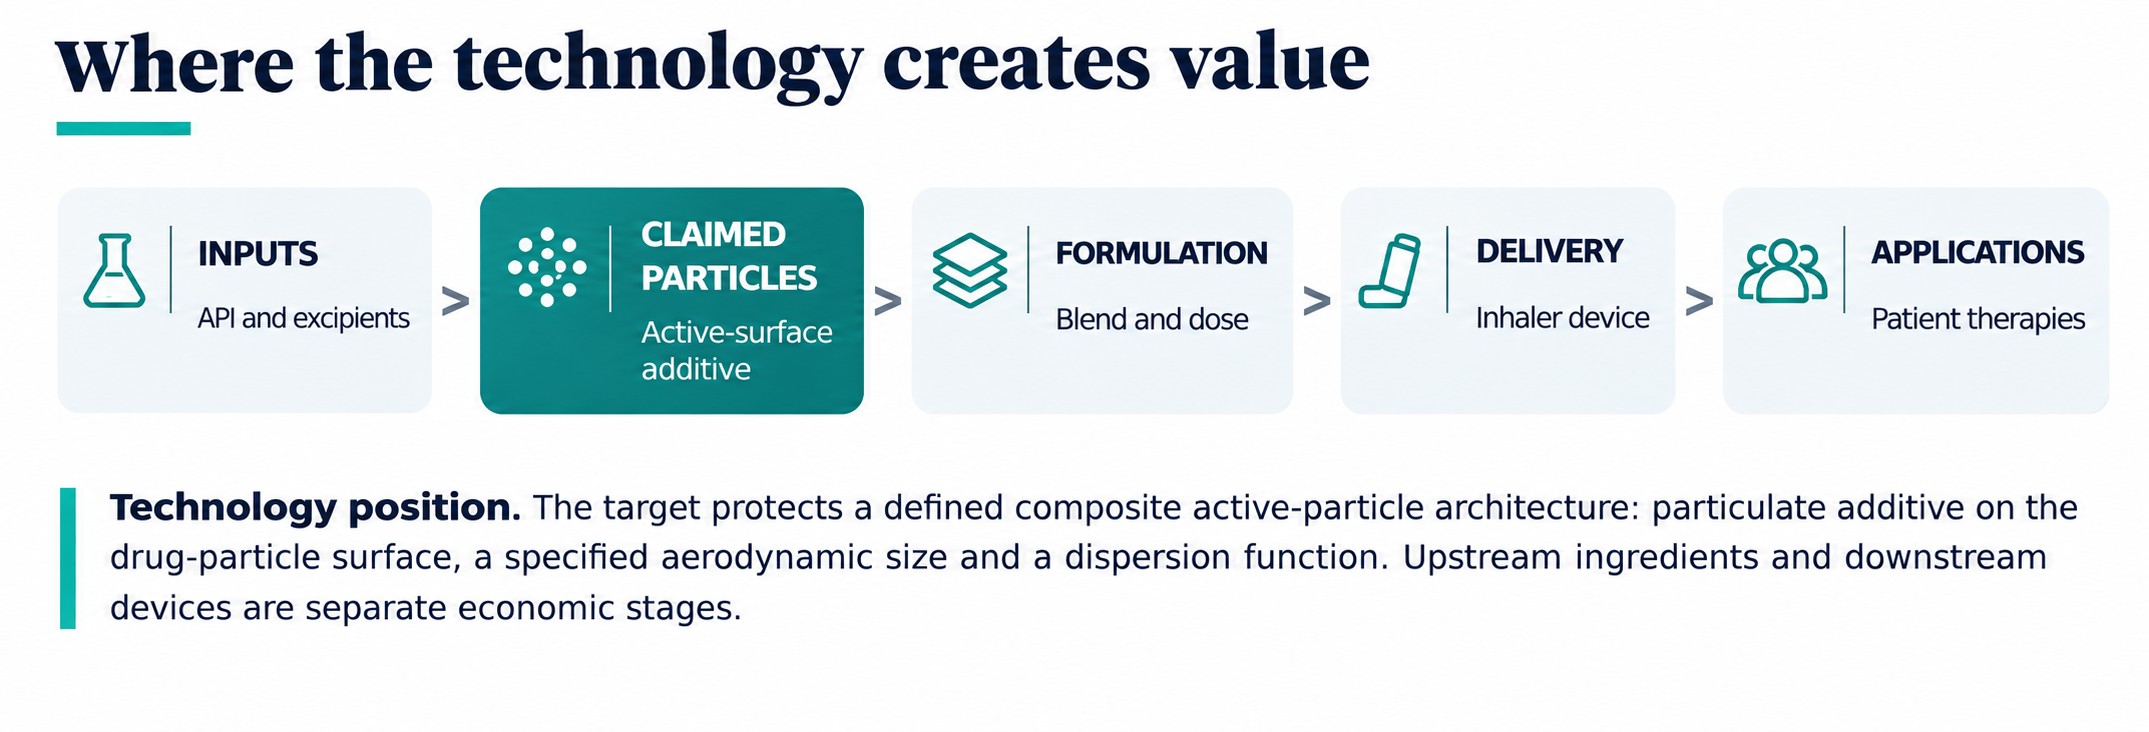
The invention at the centre of the case, US 8,303,991 B2, concerns composite active particles for pharmaceutical administration. Its technical contribution lies in the relationship between particles of an active ingredient and additive material associated with their surfaces, intended to aid dispersion. The commercial product may be a dry-powder inhaler, but the patent does not thereby confer rights over every component of that inhaler—or the entire therapeutic franchise.
That distinction is fundamental. A claim must be read element by element. A technically related product is not automatically a product practising the claimed invention, and neither a shared therapeutic application nor a similar manufacturing objective establishes patent coverage. The first task is therefore a claim-centred validity and prior-art assessment: identify the limitations that matter, the earlier disclosures that bear on them, and the alternative implementations that might remain available.
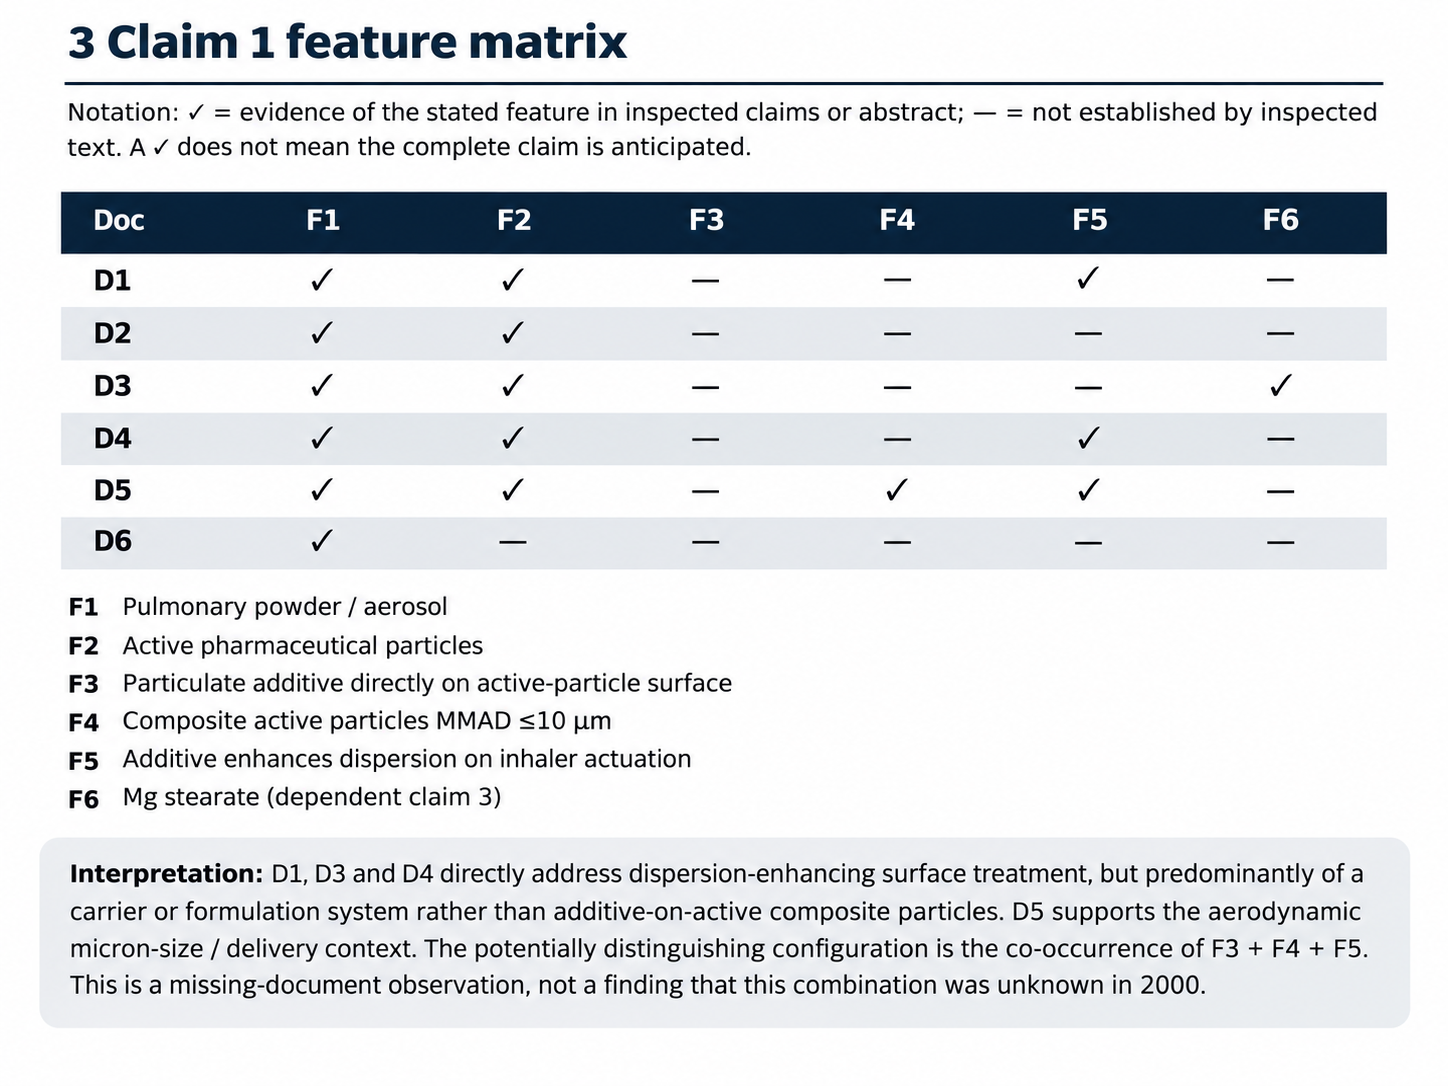
The Vectura validity search example shows why claim construction changes the analysis. The search identified pre-priority dry-powder patents describing surface additives, including coatings on larger carrier particles. Yet the target claim requires additive on the active-material particle itself, together with an aerodynamic size limit and dispersion function. That does not establish validity; it identifies the factual and technical distinction that a serious validity investigation must test.
From patent claims to competitive position
A claim analysis provides a boundary, not yet a valuation. The next question is whether that boundary matters to technology users. For Vectura, the relevant comparison is not simply the number of inhaler patents in circulation. It is the evolution of particle engineering: surface additives, carrier-based formulations, dispersion technologies, manufacturing routes and competing approaches to pulmonary delivery.
A rigorous patent landscape can place the invention among these alternatives, distinguish technically meaningful patent families from loose citation neighbours, and identify which organisations are active in which segments. The objective is to understand technical substitutability and potential negotiating leverage—not to present a long list of competitors or interpret citation scores as monetary values.
In the illustrative patent landscape report, an initial network exploration surfaced 1,194 distinct publications, which were narrowed to 100 screened assignee–patent observations and 85 provisional corporate groups. The distinction is as important as the counts: a discovery set is not a validated portfolio census, and the aggregated citation scores of representative patents cannot be described as the complete strength of any company's holdings.
That changes how a valuer thinks about protection scope. A narrowly drafted claim may still be commercially important if viable alternatives are expensive, poorly performing or difficult to manufacture. Conversely, a broad-looking position may support a modest economic premium if competing technologies provide similar results at comparable cost. The patent's economic relevance depends on the choices available to the potential licensee.
Market exposure is not patent-attributable revenue
Only once the technical position is understood can the commercial analysis begin. Respiratory product sales establish context. They do not establish a royalty base. A product can embody numerous technologies, be sold in several territories, and contain features developed or licensed by different parties.
The purpose of a market analysis is to move from the broad industry to identifiable products and applications, then from those products to a supportable economic exposure. That requires looking at launch timing, geography, sales evidence, technology-to-product mapping and the extent to which the claimed feature contributes to the product's commercial performance.
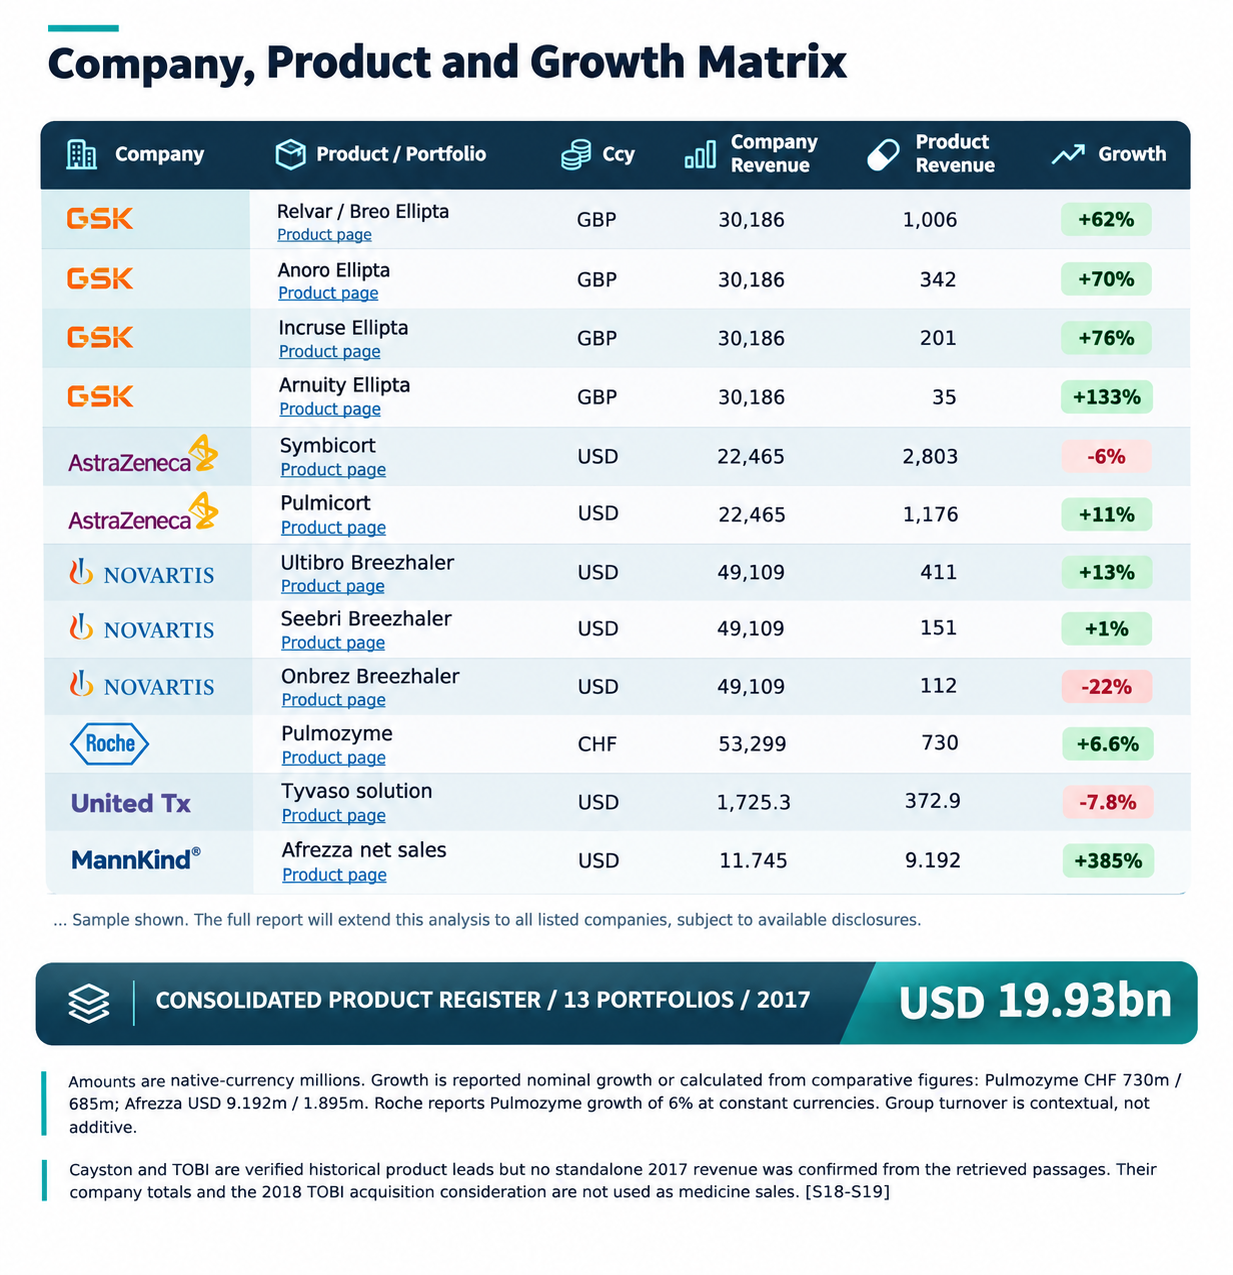
The 2017 market analysis example distinguishes GSK's reported £6.991 billion respiratory business from £1.584 billion across four identified Ellipta product lines. It separately records £50.1 million in Vectura's underlying royalty revenue, which relates to multiple partnered streams rather than the single patent. Those figures cannot be summed into a market value: they measure different layers of the same commercial ecosystem and include potential overlaps.
Even when a product and a patent appear technically relevant to one another, the question remains whether the patent owner is entitled to monetise that use. Existing licences, exhaustion, jurisdiction, remaining term, alternative technologies and enforcement costs can materially change the answer. None of those variables is solved by multiplying headline revenue by three per cent.
The licensing history makes the lesson unusually clear
The Federal Circuit's November 2020 opinion in Vectura Ltd. v. GlaxoSmithKline LLC provides a striking piece of commercial evidence. It describes a 2010 non-exclusive worldwide agreement covering more than 400 patents. That arrangement also included a non-assert provision that encompassed the application which later became the ’991 patent.
3% on the first £300 million of defined sales; 2% on the next £200 million; and no additional royalty on sales above £500 million.
These were terms of a wider negotiated arrangement, not a published standalone rate for US 8,303,991 B2.The litigation subsequently examined whether that earlier agreement could serve as a sufficiently comparable starting point for assessing damages, notwithstanding differences in the rights and economic circumstances. The court accepted the jury's damages outcome, but a judicially assessed reasonable royalty in a specific infringement dispute must not be confused with an independent price for acquiring the patent.
More subtly, a comparable licence is not just a percentage. It is a combination of rate, royalty base, covered rights, territorial scope, caps, duration and bargaining context. Removing a ceiling while retaining a nominal rate can change the economics dramatically. This is precisely why the whole agreement matters more than the number that appears in a headline.
What an independent valuer should do differently
An evidence-led patent valuation should reconcile four dimensions: the commercial importance of the protected technology; the effective scope of the claims and jurisdictions; the strength of the patent position in view of relevant prior art; and the practical ability to detect, enforce and license use. These dimensions are related, but they are not interchangeable.
Financial modelling then translates supported facts into alternative outcomes. The model should reveal which inputs are observed, which are expert judgements, and which remain unresolved. Sensitivities around product attribution, royalty structure, remaining economic life and collectability are often more informative to decision-makers than a single point estimate presented to two decimal places.
The integrated valuation example makes the uncertainty visible. Its retrospective model produces a £3.16 million base-case present value over a three-year licensing scenario, with illustrative low and high outcomes of £0.23 million and £18.43 million. These are conditional sensitivity outputs built from analyst assumptions—not verified sale prices, agreed royalties or an assertion that any particular product infringes. The range's width is itself evidence that patent-to-product attribution remains the decisive research gap.
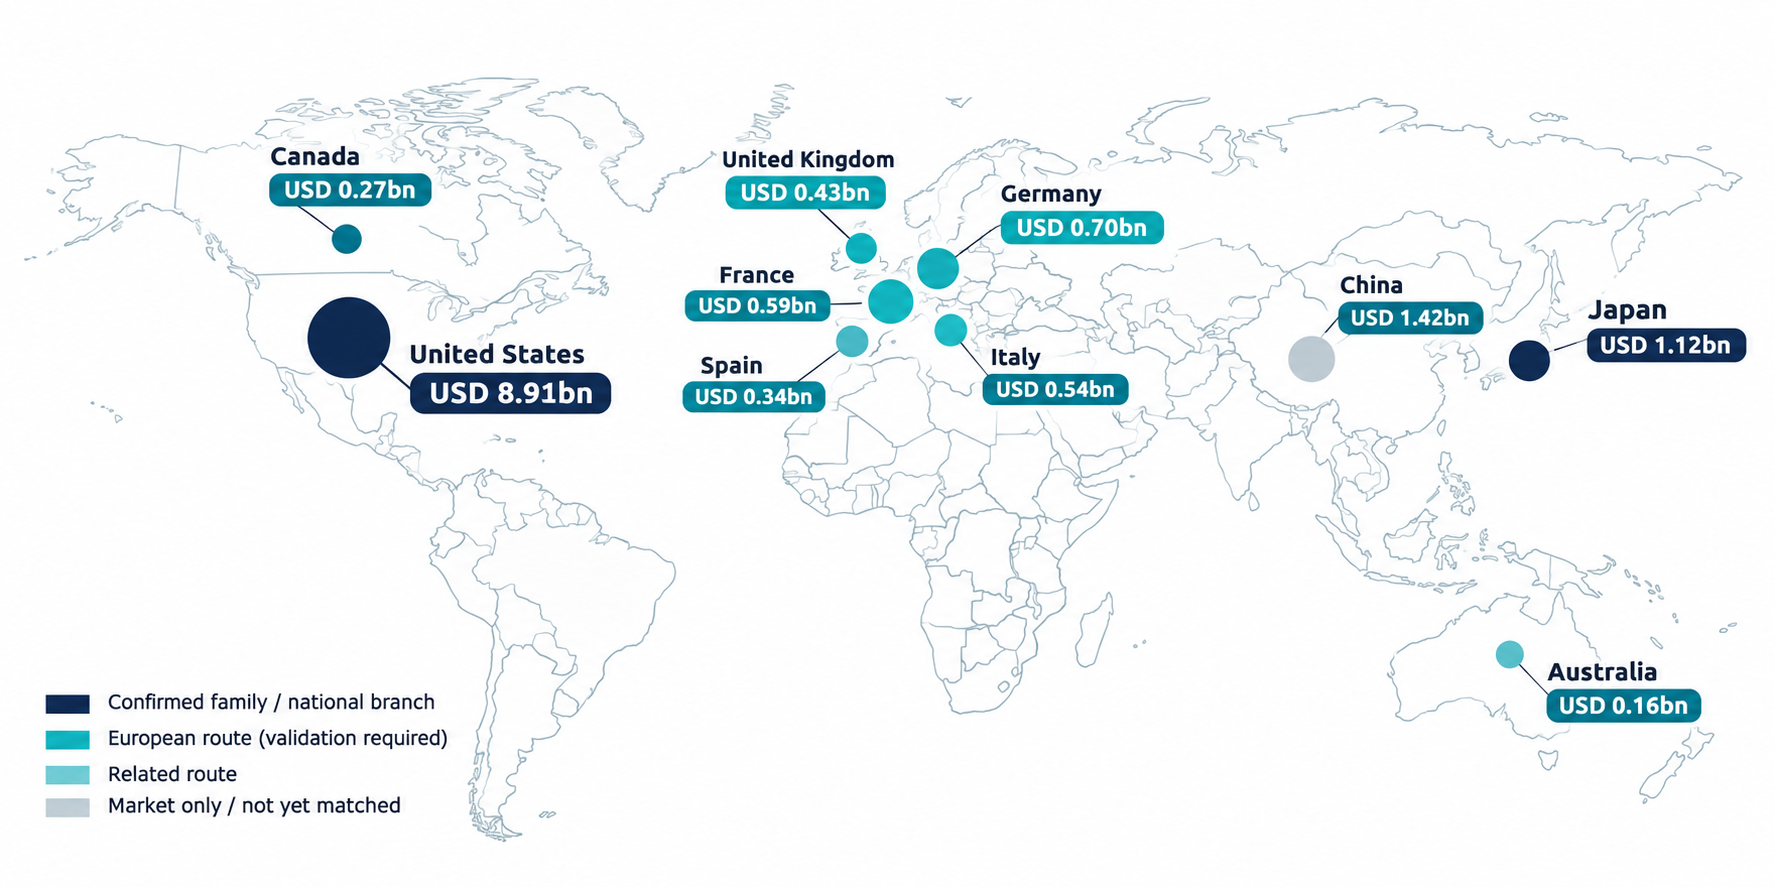
For this case study, we use a historical valuation perspective at 31 December 2017. Subsequent litigation is valuable as an external retrospective reference, but it should not be smuggled into the information available to a hypothetical market participant at that earlier date. A sound retrospective exercise draws a clear line between what was knowable at the valuation date and what later events revealed.
The value is in the chain of evidence
The lesson from Vectura is not that a particular patent is worth a particular multiple of respiratory sales. It is that credible value emerges from a sequence of increasingly specific questions: what is claimed, what competing solutions exist, which products are relevant, which rights remain monetisable, and what economic terms an informed counterparty might accept.
For IP owners, investors and patent professionals, the quality of a valuation ultimately rests on the strength of that chain. A defensible research dossier should allow another reader to follow it, challenge its assumptions and understand why the final range is what it is.